Every other UX article tells you: "fewer steps in the cart = higher conversion." Data from a sample of 150 e-shops allowed us to prove that this is a myth.
Why We Actually Did It
At ui42, we manage analytics for dozens of e-shops in Central Europe. Clients regularly ask us one of two questions:
1. “What conversion rate should we have?”
2. “Should we shorten the cart? I heard that every step costs 10% conversion.”
The second question has long been considered a truth and is cited in dozens of presentations, blogs, and UX guides. However, when we analyzed real GA4 data from 150 e-shop GA4 properties for the period January - May 2026 (5 months, sample 12.1 million sessions in total), we found that the correlation between the number of steps in the cart and the e-shop conversion is much weaker.
The results show that the number of steps in the checkout is among the less significant factors. The character and category of the product, the average order value, or the quality of the checkout process itself have a much greater impact.
Methodology in Brief
Period: January 1 – May 31, 2026 (5 months)
Sample: 150 GA4 properties of B2C e-shops in 17 product segments
Markets: SK, CZ, HU, PL, RO, SI, DE, FR, AT, US, GR, LT, BG, HR, EU
Total: 12.1 million sessions, ~300,000 transactions.
Funnel Definition (5 Cart Steps):
- view_cart - enter the cart
- begin_checkout - click on checkout
- add_shipping_info - select delivery
- add_payment_info - select payment
- purchase - confirm order
(For completeness: we distinguish between the "e-shop funnel," which is view_item → add_to_cart → 5 cart steps and the actual cart, which starts only after clicking on the cart icon. This article looks at the cart in a narrower sense.)
Main Finding
We divided 150 e-shops according to how many of the five cart steps they actually measure in GA4. Assumption: if fewer steps = higher CR, then those with fewer steps should have higher conversions.
Pearson correlation r = 0.347.
In statistics, 0.347 means a weak to moderate positive correlation. At the significance threshold with N = 150. For comparison: solid physical laws have a correlation close to 1.0. A coin toss has 0.0. "Number of steps in the cart vs. CR" is much closer to a coin toss than to a physical law.
Result: The data proves that there is currently no evidence that fewer steps in the cart reduce or increase CR. Interestingly, e-shops with complete 5-step tracking have on average twice the CR than those with 2 - 3 steps. However, this is not because the opposite seemingly illogical rule applies, it is because e-shops with well-set tracking generally have a well-set rest of the business: UX, delivery, payments, customer service.
Real-Life Examples
E-shop from the category of perfumes and household cosmetics: 4 out of 5 steps, highest CR in the portfolio
The client has configured only 4 out of 5 cart steps in GA4 and the results are clear:
- CR = 13.92%
- 267,232 sessions over 5 months
- 37,207 transactions
- `begin_checkout → purchase` ratio: 78.7%
This is the highest overall CR from the category of e-shops with a relevant sample size.
Why is that? Because their segment (cosmetics and perfumes) has low product price, high impulsiveness, emotional decision-making, and high frequency of repeat purchases. A person doesn't want to "think" about perfume, they look, click, buy. Tracking their cart is a negligible factor here.
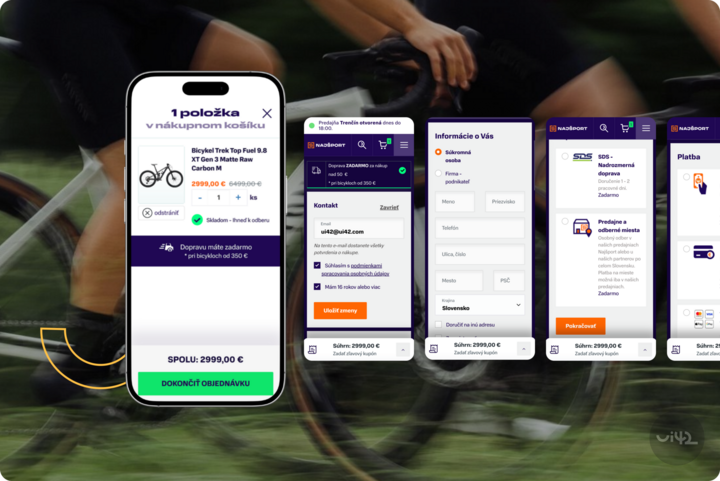
Premium Sports E-shop: 5 out of 5 steps, CR 0.51%
Najsport has complete tracking of all five steps:
- CR = 0.51%
- 117,463 sessions
- 1,506 transactions
- AOV ~€660
Why is that? Because their main assortment is goods worth hundreds to thousands of euros. Buying such goods is not impulsive. The visitor returns to the site 5 - 10 times over two months, compares, reads reviews, thinks. The vast majority of visits are "exploratory," not intent-to-buy. In this segment, therefore, the number of steps in the checkout plays a significantly smaller role than the nature of the shopping process itself.
Collectible Products: Equivalent of Two Steps, CR 0.06%
An e-shop with collectible models in multiple markets has only 2 out of 5 funnel steps functional in GA4. CR ranges from 0.06% to 0.94% depending on the market.
What Really Affects Conversion Rate
From the analysis of 150 e-shops, five factors emerged that explain CR differences much better than the number of steps in the cart.
1. Segment and Type of Goods (Strongest Driver)
Don't compare yourself to the global average "2.3%". Compare yourself to the competition in the same segment.
- Drugstore/Household: 8 – 10%
- Pharmacy: 4 – 6%
- Cosmetics: 4 – 6%
- Children's Fashion: 3 – 4%
- Fashion/Footwear: 2 – 4%
- Furniture: 1.5 – 3%
- Supplements: 2 – 4% (with a large range)
- Perfumes: 1.5 – 3%
- Sports: 0.5 – 2%
In most analyzed segments, it holds that increasing order value naturally decreases the conversion rate.
2. AOV
The vast majority of e-shops with above-average CR in our sample have AOV below €50. While most e-shops with below-average CR have AOV above €150.
It holds that the higher the order value you have, the lower the conversion rate.
Where does the conversion rate in AOV break and how to compare with the market?
3. Health of the Cart Itself
That is, `begin_checkout → purchase`, is a metric that should replace "overall CR" when discussing the cart. It says one thing: “Of those who already clicked on checkout, how many actually completed the purchase?”
This is the metric to measure the real effectiveness of the cart. Not the number of steps.
4. Mobile UX
In our sample, on average 65% of sessions are from mobile. E-shops with non-optimized mobile checkout lose a significant portion of conversions regardless of whether they have 3 or 5 steps.
The number of steps in the checkout is among the topics that have been discussed in the UX community for years. However, our analysis shows that its impact on the overall conversion rate is significantly smaller than often assumed.
In the sample of 150 e-shops, we found no evidence that simply shortening the checkout leads to higher conversion. Factors such as segment, average order value, quality of traffic, mobile user experience, or the effectiveness of the checkout process itself play a much more decisive role.
This does not mean that the checkout should not be optimized. It just means that its length should not be the first question. A much greater benefit comes from understanding where customers are leaving the shopping process and why.
If you want to improve the conversion rate, don't start by counting steps. Start with data.
Do you want to know what is hindering conversions in your e-shop?
At ui42, we analyze shopping processes based on data from GA4, Google Search Console, and other sources, also using AI agents FLUIDUM. Instead of universal recommendations, we look for specific places that have the greatest impact on your e-shop's performance.
The result is a clear answer to three questions:
- Where in the funnel you are losing customers.
- Which metrics have the greatest potential for improvement.
- What changes will have the greatest impact on the conversion rate.
If you are interested in how your e-shop stands compared to the market, we will be happy to look at your data.